Graphing of results in CONTOUR was really showing its age in GeoStudio 2004. In fact it had hardly changed since SEEP/W version 1 way back when Windows was first released, other than adding additional parameters you could graph.
I’m excited about how the graphing feature has changed in GeoStudio 2007. I’ll take the next couple of weeks to describe it, but I’ll start this week with describing how you select data to graph, to continue the selection theme (see “selection in keyin lists“, and “mouse selection“).
Data Source
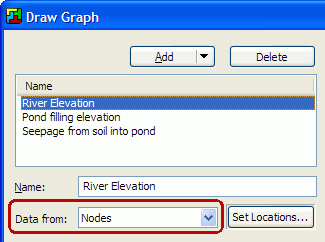
When creating a graph, one of the first things to do is to select where you want the data to come from. You can graph data from nodes or gauss regions, convergence data, or other sources depending on what kind of analysis you’re performing.

We’ll just take a look at Nodes today because I want to describe how to select nodes. The other data sources generally don’t have any selection at all, or let you select from a list.
Set Locations
After picking “Nodes” you need to choose which nodes. We call that the “Location” of the data, so you click the “Set Locations…” button.
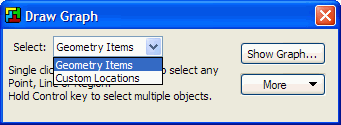
The Graph window disappears to clear up room for you to select on your drawing, and is replaced by a smaller box.

Here you can choose whether you want to select “Geometry Items” or “Custom Locations”. “Geometry Items” is the simplest–it lets you pick regions, lines and points. “Custom Locations” is the most powerful, letting you pick any coordinates you want.
Geometry Items
To pick geometry items, you use the same selection techniques we discussed last month:
- Click on any point to select it. The data will come from the node under that point.
- Click on any line to select the entire line. The data will come from each node under the line.
- Click on any region to select the entire region. The data will come from each node in the region.
And of course all the multi-selection techniques work too:
- Drag a rectangle and any points, lines or regions fully contained in the rectangle will be selected.
- Hold down Shift and click twice and any points or lines between the two clicks will be selected.
- Hold down Ctrl while selecting something and it will be added to the current selection.
- Hold down Ctrl and click on something already selected, and it will be removed from the selection.
Custom Locations
What if you want to graph data from a specific coordinate but there’s no point there to select? Maybe not even a node? Or what if you want graph along an arbitrary line, but you want to experiment with different mesh configurations?
Enter Custom Locations.
Custom Locations de-couple graphing from how the geometry is defined. You can pick any point, line, rectangle, or combination thereof. If a node exists at the location you want, the graph will use data computed at the node. If no node exists data will be interpolated from the nearest nodes to get a reasonable estimate.
- Click anywhere to graph at a point. If you’re near (within a few pixels) a node, the node will be selected, otherwise the graph will interpolate from the nearest nodes.

- Hold down Shift and click two coordinates to graph along a line. The graph will contain data for every point where your line crosses an element edge or a node.

- Drag a rectangle. The graph will contain data for every node in the rectangle.

And again you can use the multi-selection techniques to combine the above. Hold down Ctrl while clicking, shift-clicking, or dragging a rectangle and the new locations will be added to the existing ones.

When you’re done selecting where data will come from, click the “Show Graph…” button to go back to the main Draw Graph view. I’ll look more at what Draw Graph can do next week.
Filed under: ui tips | Tagged: contour, geostudio, graph, selection |


Leave a comment